Gaining Powerful Insights with API Gateway Access Logging
- Portspark Team
- Oct 25, 2022
- 6 min read

Updated: Oct 30, 2022

If you are new to API Gateway, reading the whole article might be a good place to start to understand how logs work. Alternatively, you can navigate through the following Table of Contents:
APIs are the core component of applications, as they act as the "front door" to application data. Using APIs, applications can easily access data, business logic, or other functionality from backend services.
When it comes to production applications, API monitoring is a mandatory task - without proper monitoring, you can't guarantee the availability and health of your application to your users and customers, this is what makes API monitoring super important.
From a security perspective, since APIs are the "front door" to applications data, it's extremely important to know which data has been retrieved, when it was retrieved, and who made the call.
in this article, I'll describe how to maintain a healthy API Gateway using the "API Gateway Access Logging" feature.
The Basics
Amazon API Gateway is a managed platform for creating, publishing, maintaining, monitoring, and securing APIs. Using Amazon API Gateway, you can create scalable RESTful APIs and WebSocket APIs that enable real-time two-way communication applications. API Gateway supports containerized and serverless workloads, as well as web applications.
It's a fully managed solution
As a fully managed solution, Amazon API Gateway handles all the tasks involved in accepting and processing up to hundreds of thousands of concurrent API calls, including traffic management, CORS support, authorization and access control, throttling, monitoring, and API version management.
Costs
Like any other AWS service, API Gateway costs money, but it doesn't have any minimum fees or startup costs. Hence, you only pay for the API calls you receive and the amount of data transferred out.
Good to know: API Gateway has a tiered-based pricing model, which means as your API usage scales, you move upward to a more cost-effective tier.
About API Gateway Access Logging
Access logs are single log files written out for each request that hits your API Gateway instance.
While access logs are mainly used to provide a general summary of the request — what time the request occurred, the HTTP method and path that was requested, the response latency, and request status (200, 400, 401, 502, etc), there is an option to customize the log structure and map additional fields into the log - this is how you get into powerful insights with access logging alone without getting into whole the noise made by "API Gateway Execution Logs" (Which we won't elaborate more on this right now).
To sum it up, "API Access Logging" can be easily customized to be super useful for troubleshooting and debugging API calls, and even be used for API performance analysis.
Why API calls might fail?
The elements in API Gateway can vary from one setup to another, what you need to understand is that lots of things can go wrong:
Wrong authorizer
Messed up request
Processing request incorrectly in your Lambda function
Processing request correctly in your Lambda function but returning the wrong shape back to API Gateway

This is where API access logs and execution logs come in handy - while execution logs provide comprehensive detail on each call, with the right customization you can easily identify most of the problems in your entire API Gateway and its underlying elements.
The right way to configure the API Gateway Access Logging
Let's learn how we enable access logging on Amazon API Gateway
Step 1 - Creating the IAM role used for logging
In order to push logs from API Gateway into CloudWatch, we've to create IAM Role (A service account) which will be responsible for this job.
Go to AWS/IAM/Roles.
Click on "Create role".
Select "AWS service" and choose "API Gateway" under "Use cases for other AWS services".
On the "Add permissions" page, the permission policy you need will be attached automatically, so just hit "Next".
On the "Name, review and create" page, provide a name for your role - in this example we've named our role as "PortsparkApiGatewayCloudWatchRole".
Go to the button of the page and click on the button "Create role".
Copy the Role ARN and put it aside (or get back to it later).


Step 2 - Creating CloudWatch log group
In order to save and store your API access logs, We need to create a CloudWatch log group.
Go to AWS/CloudWatch/Log groups.
Click on "Create log group" in the top right corner.
Provide a name to your log group.
Set retention - I'd recommend setting a retention policy of up to 30 days, and not less than 7 days.
Copy the log group ARN and put it aside (or get back to it later).


Step 3 - Enabling API Access Logging on your API Gateway
Go to AWS/API Gateway.
Choose your API Gateway and click on "Settings" on the left side menu
Copy the ARN of the Role that we created earlier.
Click on "Stages" on the left side menu
Click on "Logs/Tracing"
Under "Custom Logging", check the box "Enable Access Logging"
Copy the CloudWatch log group ARN that we created earlier (make sure to remove ":*")
Move to "Step 4" below to copy the JSON log format.
Hit "Save Changes".


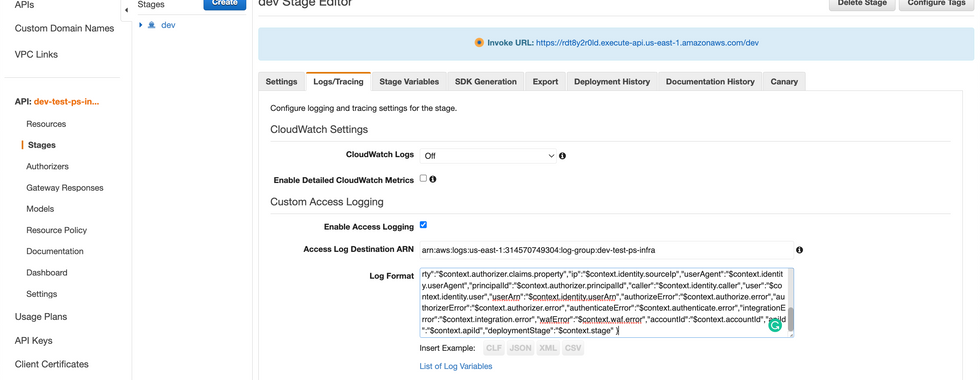
Step 4 - Building the right log structure and fields mapping (Log Format)
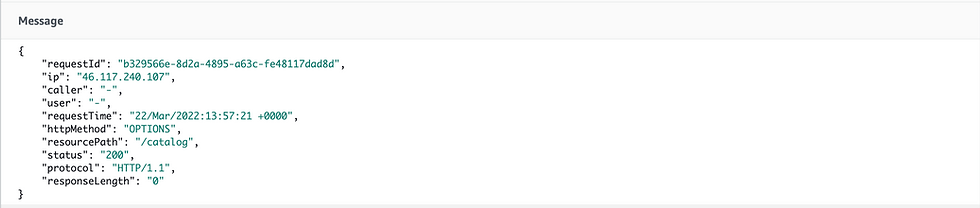
The code snippet below includes basic fields in JSON format which are mapped by default for access logging (this is what you DON'T want to use).
{ "requestId":"$context.requestId","ip": "$context.identity.sourceIp","caller":"$context.identity.caller", "user":"$context.identity.user","requestTime":"$context.requestTime","httpMethod":"$context.httpMethod","resourcePath":"$context.resourcePath","status":"$context.status","protocol":"$context.protocol", "responseLength":"$context.responseLength" }This is what you'll see in your CloudWatch Log group when using the default fields:
The code snippet below includes the magical fields in JSON format that you DO want to use in order to gain powerful insights using access logs alone:
{ "requestTime":"$context.requestTime","requestTimeEpoch":"$context.requestTimeEpoch","requestId":"$context.requestId","httpMethod":"$context.httpMethod","domainName":"$context.domainName","path":"$context.path","resourcePath":"$context.resourcePath","responseLength":"$context.responseLength","responseLatency":"$context.responseLatency","xrayTraceId":"$context.xrayTraceId","status":"$context.status","functionResponseStatus":"$context.integration.status","integrationServiceStatus":"$context.integration.integrationStatus","integrationRequestId":"$context.integration.requestId","integrationLatency":"$context.integration.latency","authorizeStatus":"$context.authorize.status","authorizerStatus":"$context.authorizer.status","authorizerLatency":"$context.authorizer.latency","authorizerRequestId":"$context.authorizer.requestId","authorizerProperty":"$context.authorizer.property","authorizerClaimsProperty":"$context.authorizer.claims.property","ip":"$context.identity.sourceIp","userAgent":"$context.identity.userAgent","principalId":"$context.authorizer.principalId","caller":"$context.identity.caller","user":"$context.identity.user","userArn":"$context.identity.userArn","authorizeError":"$context.authorize.error","authorizerError":"$context.authorizer.error","authenticateError":"$context.authenticate.error","integrationError":"$context.integration.error","wafError":"$context.waf.error","accountId":"$context.accountId","apiId":"$context.apiId","deploymentStage":"$context.stage" }And this is what you'll see with customized fields mapping:
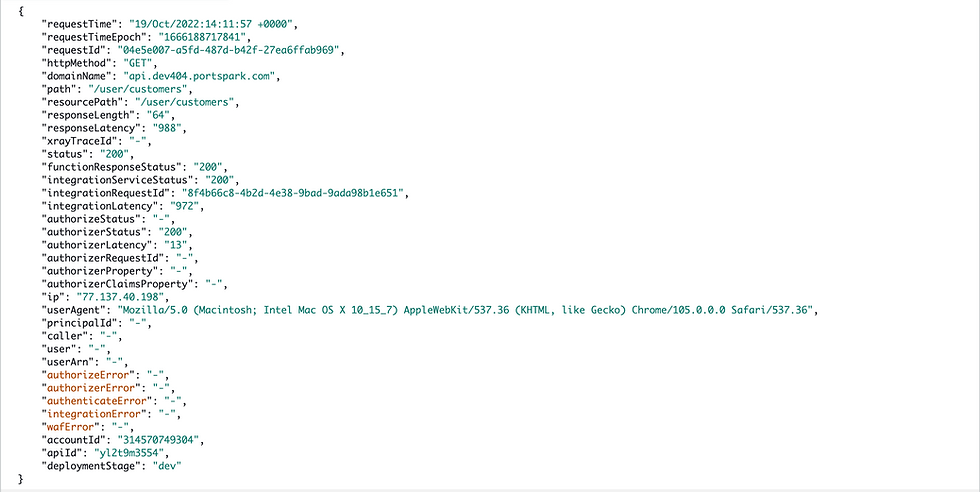
As you can see from both images above, with custom fields mapping you get much more details for each call that has been processed by your API Gateway - this is what will provide you with almost all the information you need to track and trace errors.
The table below provides an in-depth explanation of the different variables which we map into for comprehensive analysis:
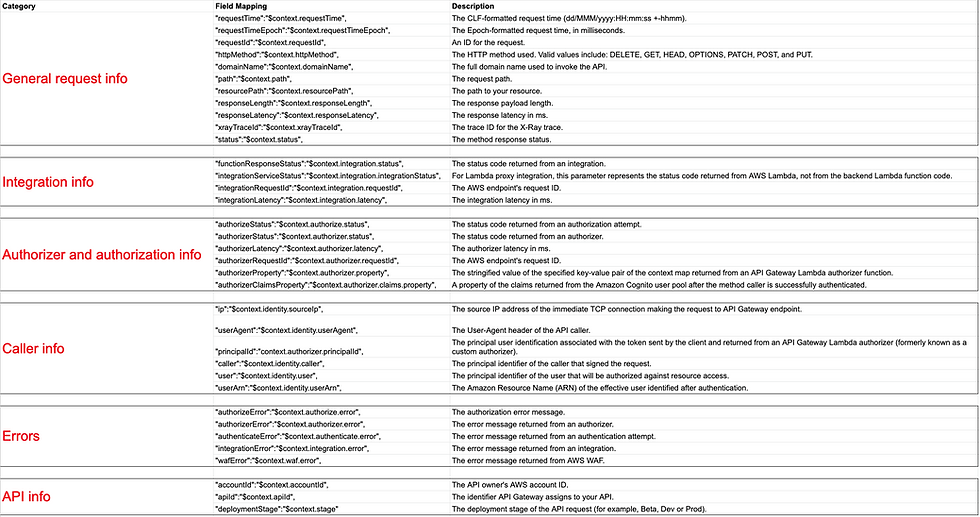
For additional info about all the available variables, you are welcome to explore more on the link below - API Gateway mapping template and access logging variable reference:
Investigating API access logs using Amazon CloudWatch
Now after we mapped and configured the powerful fields, let's explore how easily we can identify errors across the different elements used by our API.
Go to AWS/CloudWatch/Log Groups
Locate and open the log group which contains the API Gateway access logs
Click on "Search all log streams" in the top right corner

Get a View of the Powerful Insights
With this insightful logs data, we can see that we've managed to trace errors related to API attacks, permissions errors, authentication errors, and code errors.
To easily trace the most interesting logs, I've used the following filter to exclude logs with HTTP 200 status:
{ $.status != 200 }


Amazon CloudWatch vs. Portspark Cloud Platform
While you can obviously use Amazon CloudWatch to track and trace errors across API Gateways, analysis of each call is a painful event that will take you a lot of time, effort, and money - Let's understand why:
What are the problems with analyzing API access logs using CloudWatch?
When using CloudWatch log events you need to be familiar with the filter and pattern syntax, if you choose to use CloudWatch Logs Insights you need to learn how to use the query syntax - in both options, every filter you use or search you make costs you money.
When having multi-API Gateways across different regions and different AWS accounts, you have to switch to the relevant region and/or account to make a query.
To summarize all of the above, this is what you'll experience using CloudWatch:
Learning how to use the CloudWatch Logs Filter and pattern syntax https://docs.aws.amazon.com/AmazonCloudWatch/latest/logs/FilterAndPatternSyntax.html
Learning how to use CloudWatch Logs Insights query syntax https://docs.aws.amazon.com/en_us/AmazonCloudWatch/latest/logs/CWL_QuerySyntax.html
It costs you money! Every filter, search, and query you make.
Switch between AWS accounts
Switch between AWS regions
Why Portspark Cloud Platform is a better choice for analyzing API access logs?
Developed from the ground up for efficiency, our API monitoring service is fast, robust, and incredibly easy to use.
The benefits of using Portspark Cloud Platform:
You don't need to learn any query language.
You don't need to switch between accounts or regions.
You don't pay for each query you make.
All API Gateway access logs are accessible from one place - it doesn't matter on which account or region they were deployed, you can access them all, through one interface.
What are you waiting for?
Get started with the Portspark Cloud Platform today!

Comments